Paramount SSR+
Complex Data Reporting Tool
Self Serve Research Plus (SSR+) provides teams across the company with streamlined access to vast, complex data in a unified tool - vital for tracking, managing, and reporting how billions of dollars are spent accross Paramount’s advertising platforms.
Through my design work, SSR+ became part of a marketable, industry-first product suite, helping our research and sales teams generate granular insights faster.
Company
Paramount
Objective
Transform a complex legacy tool into a revenue-generating SaaS platform, delivering fast, granular ad insights to power billions in ad spend across Paramount
My Role
Product Designer responsible for UX research, ideation, wireframing, prototyping, testing & design QA
Timeline
2023-2024
Problem
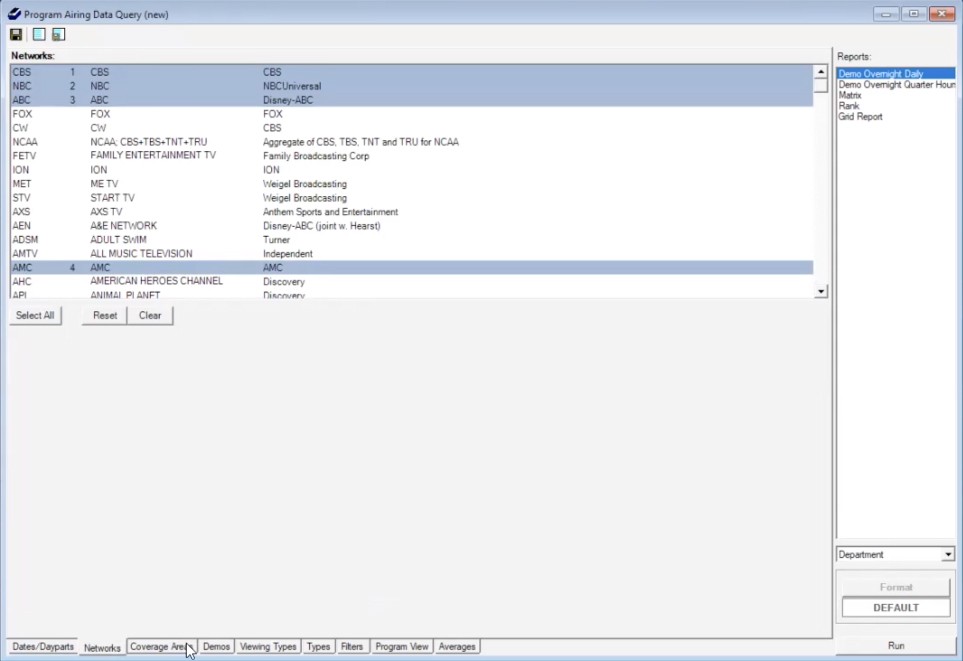
At Paramount, billions of advertising dollars flow through multiple networks, each generating vast amounts of performance data. The legacy tool, while powerful, faced several critical challenges that limited its potential impact on the business:
Siloed Usage Patterns
Originally designed for a single team's workflow, the tool struggled to serve diverse research and reporting needs across Paramount's network portfolio. Each network had developed unique approaches to research and reporting, creating operational inefficiencies and making cross-network analysis challenging.
Data Fragmentation
The lack of standardization in reporting formats and data analysis approaches made it difficult to generate consistent insights across networks. This fragmentation hindered leadership's ability to make data-driven decisions about advertising strategy at a portfolio level.
Legacy Tool
Discovery & Research
Through extensive user research and system analysis, I developed a deep understanding of both current and potential user needs:
Conducted in-depth interviews with existing power users to understand essential workflows.
Mapped feature usage patterns to identify both critical and underutilized functionality.
Performed usability tests with diverse user groups across networks to uncover pain points and opportunities.
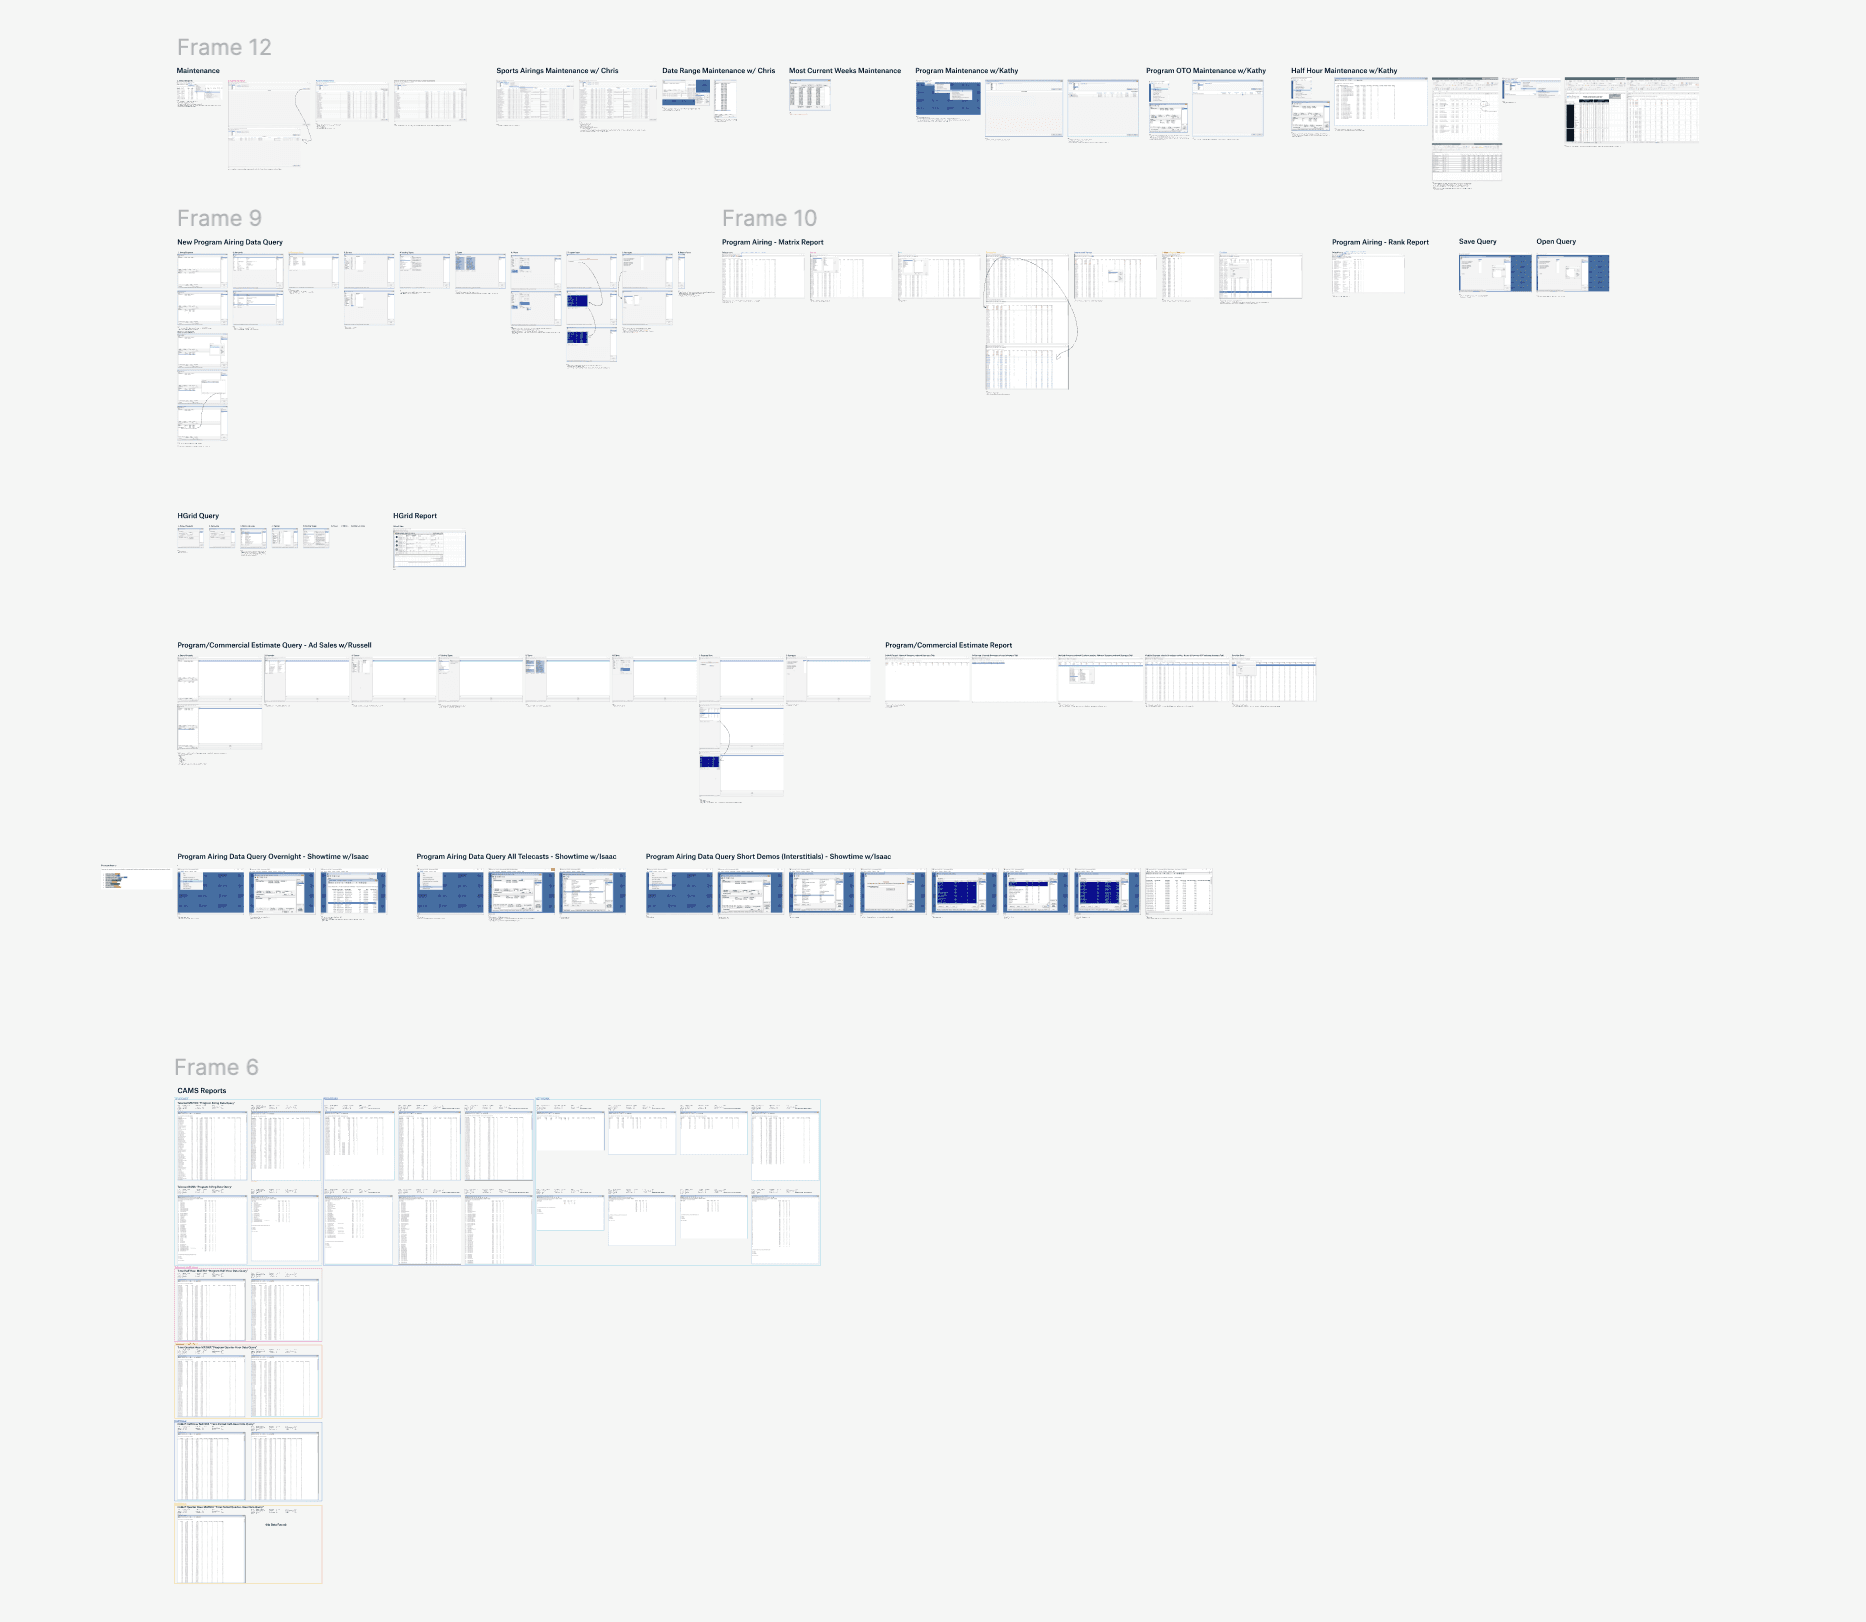
Created a comprehensive feature map of the legacy system to ensure no critical capabilities were lost in the transition.
Legacy Tool Feature Mapping
Design Strategy
Our approach focused on three key pillars:
Unified Experience
Designed a flexible template system accommodating different network reporting needs while maintaining consistency.
Implemented cross-network reporting capabilities with clear data source indicators.
Enterprise-Ready Architecture
Built scalable user permission systems to support different access levels.
Designed export and sharing features for easy collaboration.
Created comprehensive audit trails for data lineage.
Implemented robust error handling and validation to prevent incorrect data combinations.
Key Features
Intelligent Workflow Assistant
Step-by-step guidance for complex queries.
Smart defaults based on user role and history.
Clear previews of how choices affect final reports.
Unified Data Explorer
Centralized access to cross-network data.
Standardized metrics and definitions.
Flexible filtering and segmentation options.
Collaboration Hub
Shared workspace for team analysis.
Impact & Results
The redesigned SSR+ platform transformed how teams across Paramount access and utilize advertising insights:
Efficiency Gains
Reduced time-to-insight by an estimated 60% through streamlined workflows.
Decreased new user onboarding time from weeks to days.
Eliminated duplicate reporting work across networks.
User Adoption
3x increase in active users across different network teams.
85% user satisfaction rate in post-launch surveys.
Significant increase in usage of advanced features previously ignored.
Cross-Network Impact
Enabled first-ever unified view of advertising performance across Paramount's portfolio.
Standardized reporting led to more confident decision-making.
Improved collaboration between previously siloed teams.
Business Outcomes
Positioned Paramount as an innovation leader in advertising analytics.
Reduced manual data processing time by 60%.
Decreased support tickets by 50% through improved UX.
Enabled faster response to market opportunities.
Key Learnings
Process Insights
Early involvement of diverse user groups was crucial for building a truly flexible solution.
Iterative testing with power users helped maintain advanced functionality while improving usability.
Building modular components allowed for customization while maintaining consistency.
Success Factors
Strong focus on user education and contextual guidance.
Balance between simplification and maintaining powerful features.
Careful consideration of different network needs in core architecture.
Reflection
This project demonstrated how thoughtful UX design can transform complex enterprise tools into valuable products. By focusing on user needs while maintaining powerful functionality, we created a solution that not only solved immediate problems but opened new business opportunities.
The success of SSR+ validated our approach to enterprise UX design: simplify complex workflows without sacrificing capability, unify disparate processes without forcing rigid standardization, and create value through better user experience.


